Customer loyalty in grocery is built in small moments.
A reliable delivery. A relevant offer. A smooth reorder. A substitution that still feels right.
That is why measuring customer loyalty cannot stop at a single score or a once-a-quarter report. Grocery retailers need a practical way to understand who comes back, how often they order, how much they spend, and where the experience starts to break down. As online grocery keeps growing, getting this right matters even more.
In this guide, we will walk through the customer loyalty metrics that matter most for grocery retailers, how to calculate them, and how to use them to improve retention, repeat purchases, and long-term customer value.
Why Measuring Customer Loyalty Matters in Grocery
Customer acquisition costs have increased by roughly 60% over the past five years. For grocery retailers, where average order values are modest and purchase frequency is high, this makes retention far more cost-effective than acquisition.
Consider these realities:
- 82% of companies agree that retaining existing customers is significantly cheaper than acquiring new ones
- A 5% increase in retention can boost profits by 25% or more
- Loyal grocery shoppers tend to increase their basket size over time and are more open to trying new product categories
Without a clear measurement framework, you are flying blind. You cannot improve what you do not measure, and in grocery retail, small shifts in loyalty metrics can translate into significant revenue gains across your store network.
8 Customer Loyalty Metrics Every Grocery Retailer Should Track
1. Customer Retention Rate
Customer retention rate measures the percentage of customers who continue shopping with you over a defined period. It is the most fundamental loyalty metric and your starting point for any customer loyalty analysis.
Formula:
Grocery example: You start Q1 with 10,000 active online shoppers. During the quarter, you gain 2,000 new customers and end with 10,500. Your retention rate is (10,500 - 2,000) / 10,000 = 85%.
There is no single retention benchmark that fits every grocery retailer. Store format, channel mix, geography, and purchase cadence all affect the number. What matters most is whether retention is improving over time and how it varies by store, channel, and customer cohort.
What to watch for: Track retention by channel (web, mobile app, phone orders) to identify where customers drop off.
2. Repeat Purchase Rate (RPR)
Repeat purchase rate tells you what share of your customers comes back for a second (or third, or tenth) order. In grocery, where shopping is a recurring need, this metric is especially powerful.
Formula:
Grocery example: Out of 5,000 customers in a given month, 3,500 have ordered more than once. Your RPR is 3,500 / 5,000 = 70%.
Rather than chasing a universal repeat purchase benchmark, focus on how quickly first-time customers place their second order. If that number is weak, investigate onboarding friction. Customers who have a poor first experience with your e-shop or app rarely come back.
3. Purchase Frequency
Purchase frequency measures how often customers place orders within a set timeframe. For grocery, this is a critical loyalty KPI because the nature of the business demands regular, recurring purchases.
Formula:
Grocery example: In a quarter, your platform processes 40,000 orders from 10,000 unique customers. Purchase frequency is 40,000 / 10,000 = 4 orders per quarter, or roughly once every 3 weeks.
Leading grocery retailers aim for weekly or biweekly online ordering frequency among their most engaged segments. If your frequency is dropping, it may indicate that customers are splitting their spend across competitors or returning to physical-only shopping.
4. Customer Lifetime Value (CLV)
Customer lifetime value quantifies the total revenue a customer generates throughout their relationship with your business. It is widely considered the most important metric in grocery retail because it shifts your focus from individual transactions to long-term relationships.
Formula:
Grocery example: If your average order value is $85, customers order 3 times per month, and they stay active for an average of 3 years, then CLV = 85 x 3 x 36 = $9,180.
A strong CLV should be at least three times the cost of acquiring that customer. When you know your CLV, you can make smarter decisions about how much to invest in loyalty programs, personalized promotions, and retention campaigns.
5. Average Basket Size and Upsell Ratio
Average basket size tracks the monetary value per order, while the upsell ratio measures how many customers purchase additional or higher-value items beyond their initial selection. Together, they reveal whether loyal customers are deepening their relationship with your store.
Upsell Ratio Formula:
Grocery example: A shopper who initially orders only staples (milk, bread, eggs) but gradually adds premium products, fresh deli items, or organic selections is signaling growing loyalty and trust.
Tracking basket composition over time, not just basket value, helps you identify which product categories drive loyalty and where cross-selling opportunities exist.
6. Net Promoter Score (NPS)
Net Promoter Score measures how likely your customers are to recommend your store to others. It captures the emotional side of loyalty that transactional metrics cannot.
How it works: Ask customers a single question: "On a scale of 0 to 10, how likely are you to recommend our store to a friend or colleague?"
- Promoters (9-10): Your most loyal advocates
- Passives (7-8): Satisfied but not enthusiastic
- Detractors (0-6): At risk of switching to a competitor
Formula:
For grocery retailers, NPS is especially valuable after key touchpoints: first delivery, a substitution experience, or a loyalty reward redemption. The follow-up question, "What is the main reason for your score?", is where the real insights live.
7. Churn Rate
Churn rate measures the percentage of customers who stop shopping with you over a given period. It is the inverse of retention and often the most sobering metric on the dashboard.
Formula:
Grocery example: If you start the month with 8,000 active customers and 400 do not return within their expected purchase cycle, your churn rate is 400 / 8,000 = 5%.
If churn is rising month after month, investigate quickly. Common causes include poor delivery experiences, out-of-stock items, inconsistent product quality, weak reorder flows, or a lack of personalized engagement.
Pro tip: Segment your churn analysis by customer tenure. Losing a first-time buyer is different from losing a 2-year loyal customer, and each requires a different recovery strategy.
8. Customer Loyalty Index (CLI)
The Customer Loyalty Index combines multiple loyalty signals into a single, trackable score. It goes beyond any individual metric to give you a holistic view of customer loyalty over time.
How it works: Survey customers with three questions:
- How likely are you to purchase from us again in the future?
- How likely are you to try other products or services from us?
- How likely are you to recommend us to friends and family?
Customers respond on a scale of 1 to 6, and you calculate the average across all three questions.
CLI is especially useful for grocery retailers managing multiple store locations or channels. It allows you to benchmark loyalty across regions, formats, or customer segments and identify where experience gaps exist.
From Metrics to Action: What This Means for Your Grocery Business
Tracking loyalty metrics is only the first step. The value appears when your team can actually see those signals in one place and act on them fast.
That is where many grocery retailers get stuck.
Orders live in the ecommerce platform. Customer points live in the loyalty system. Delivery data lives somewhere else. Reporting is fragmented. You can measure parts of customer loyalty, but not the full picture.
For multi-store grocers, that fragmentation becomes expensive. It also makes it harder to reduce marketplace dependency and build direct customer ownership over time.
To improve retention, repeat purchases, and customer lifetime value, you need:
- one view of customer behavior across web, app, phone orders, and stores
- store-level and HQ-level reporting
- visibility into order frequency, basket growth, loyalty usage, and churn signals
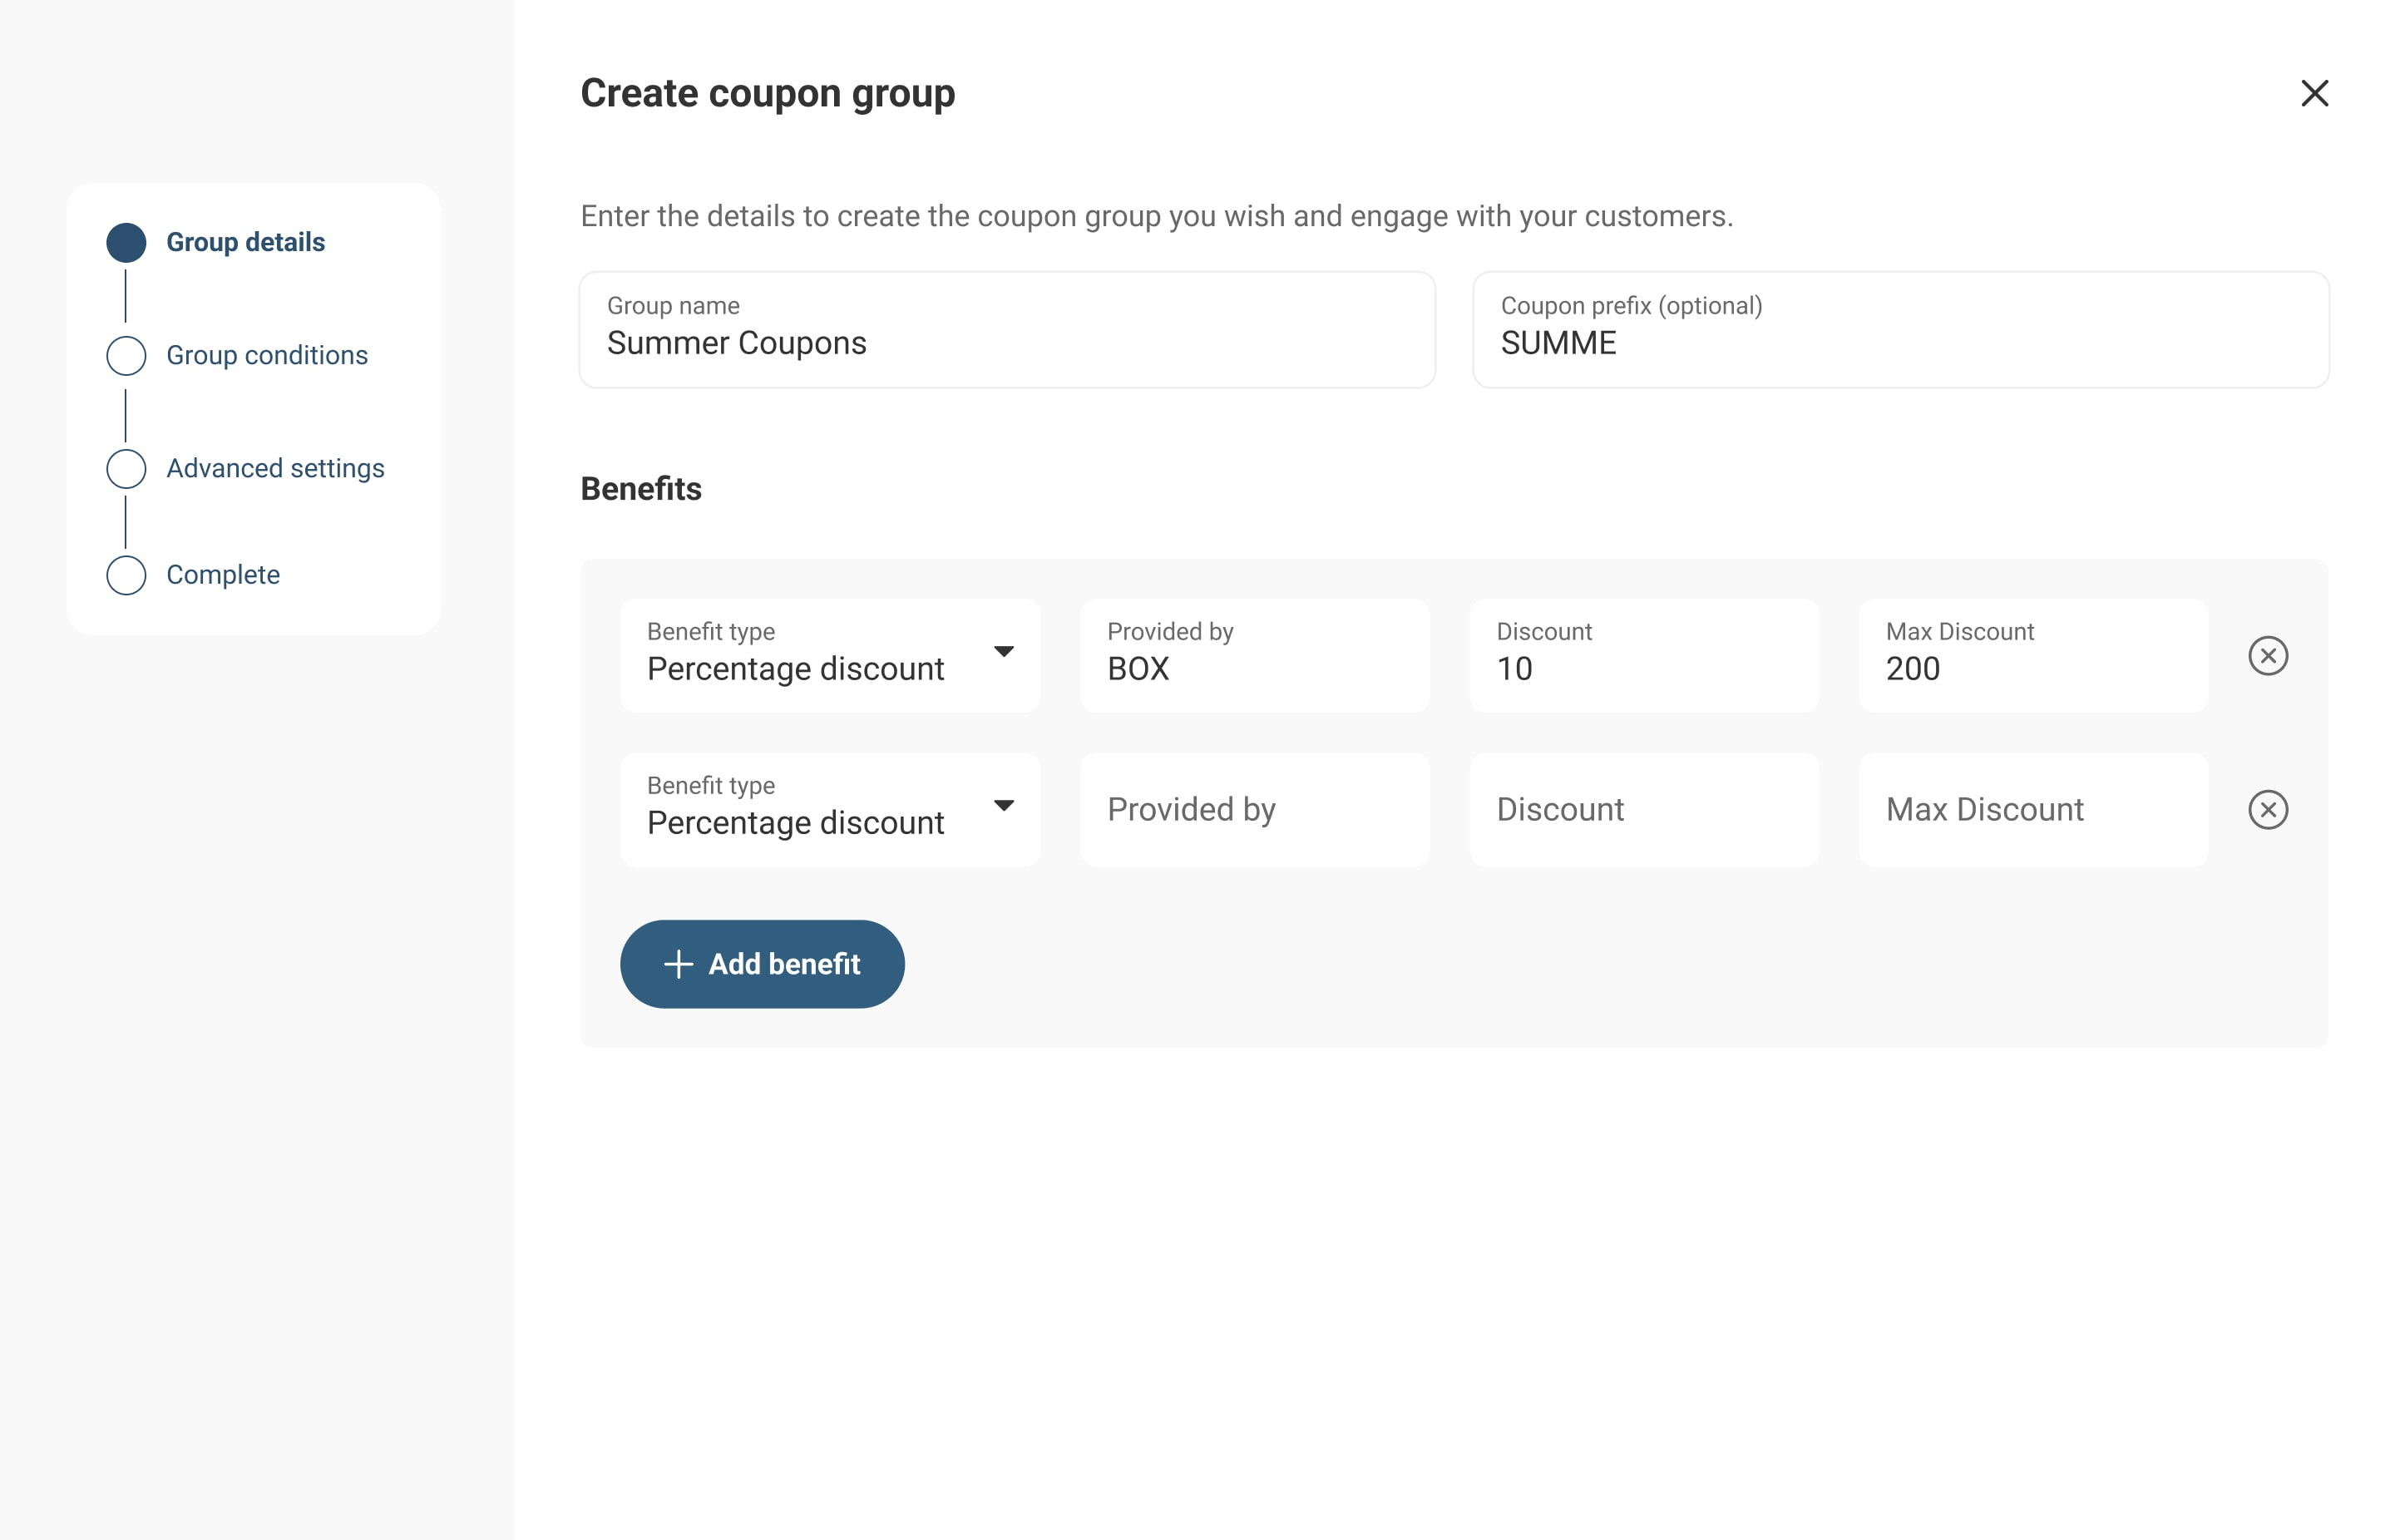
- the ability to connect promotions, loyalty actions, and operational performance
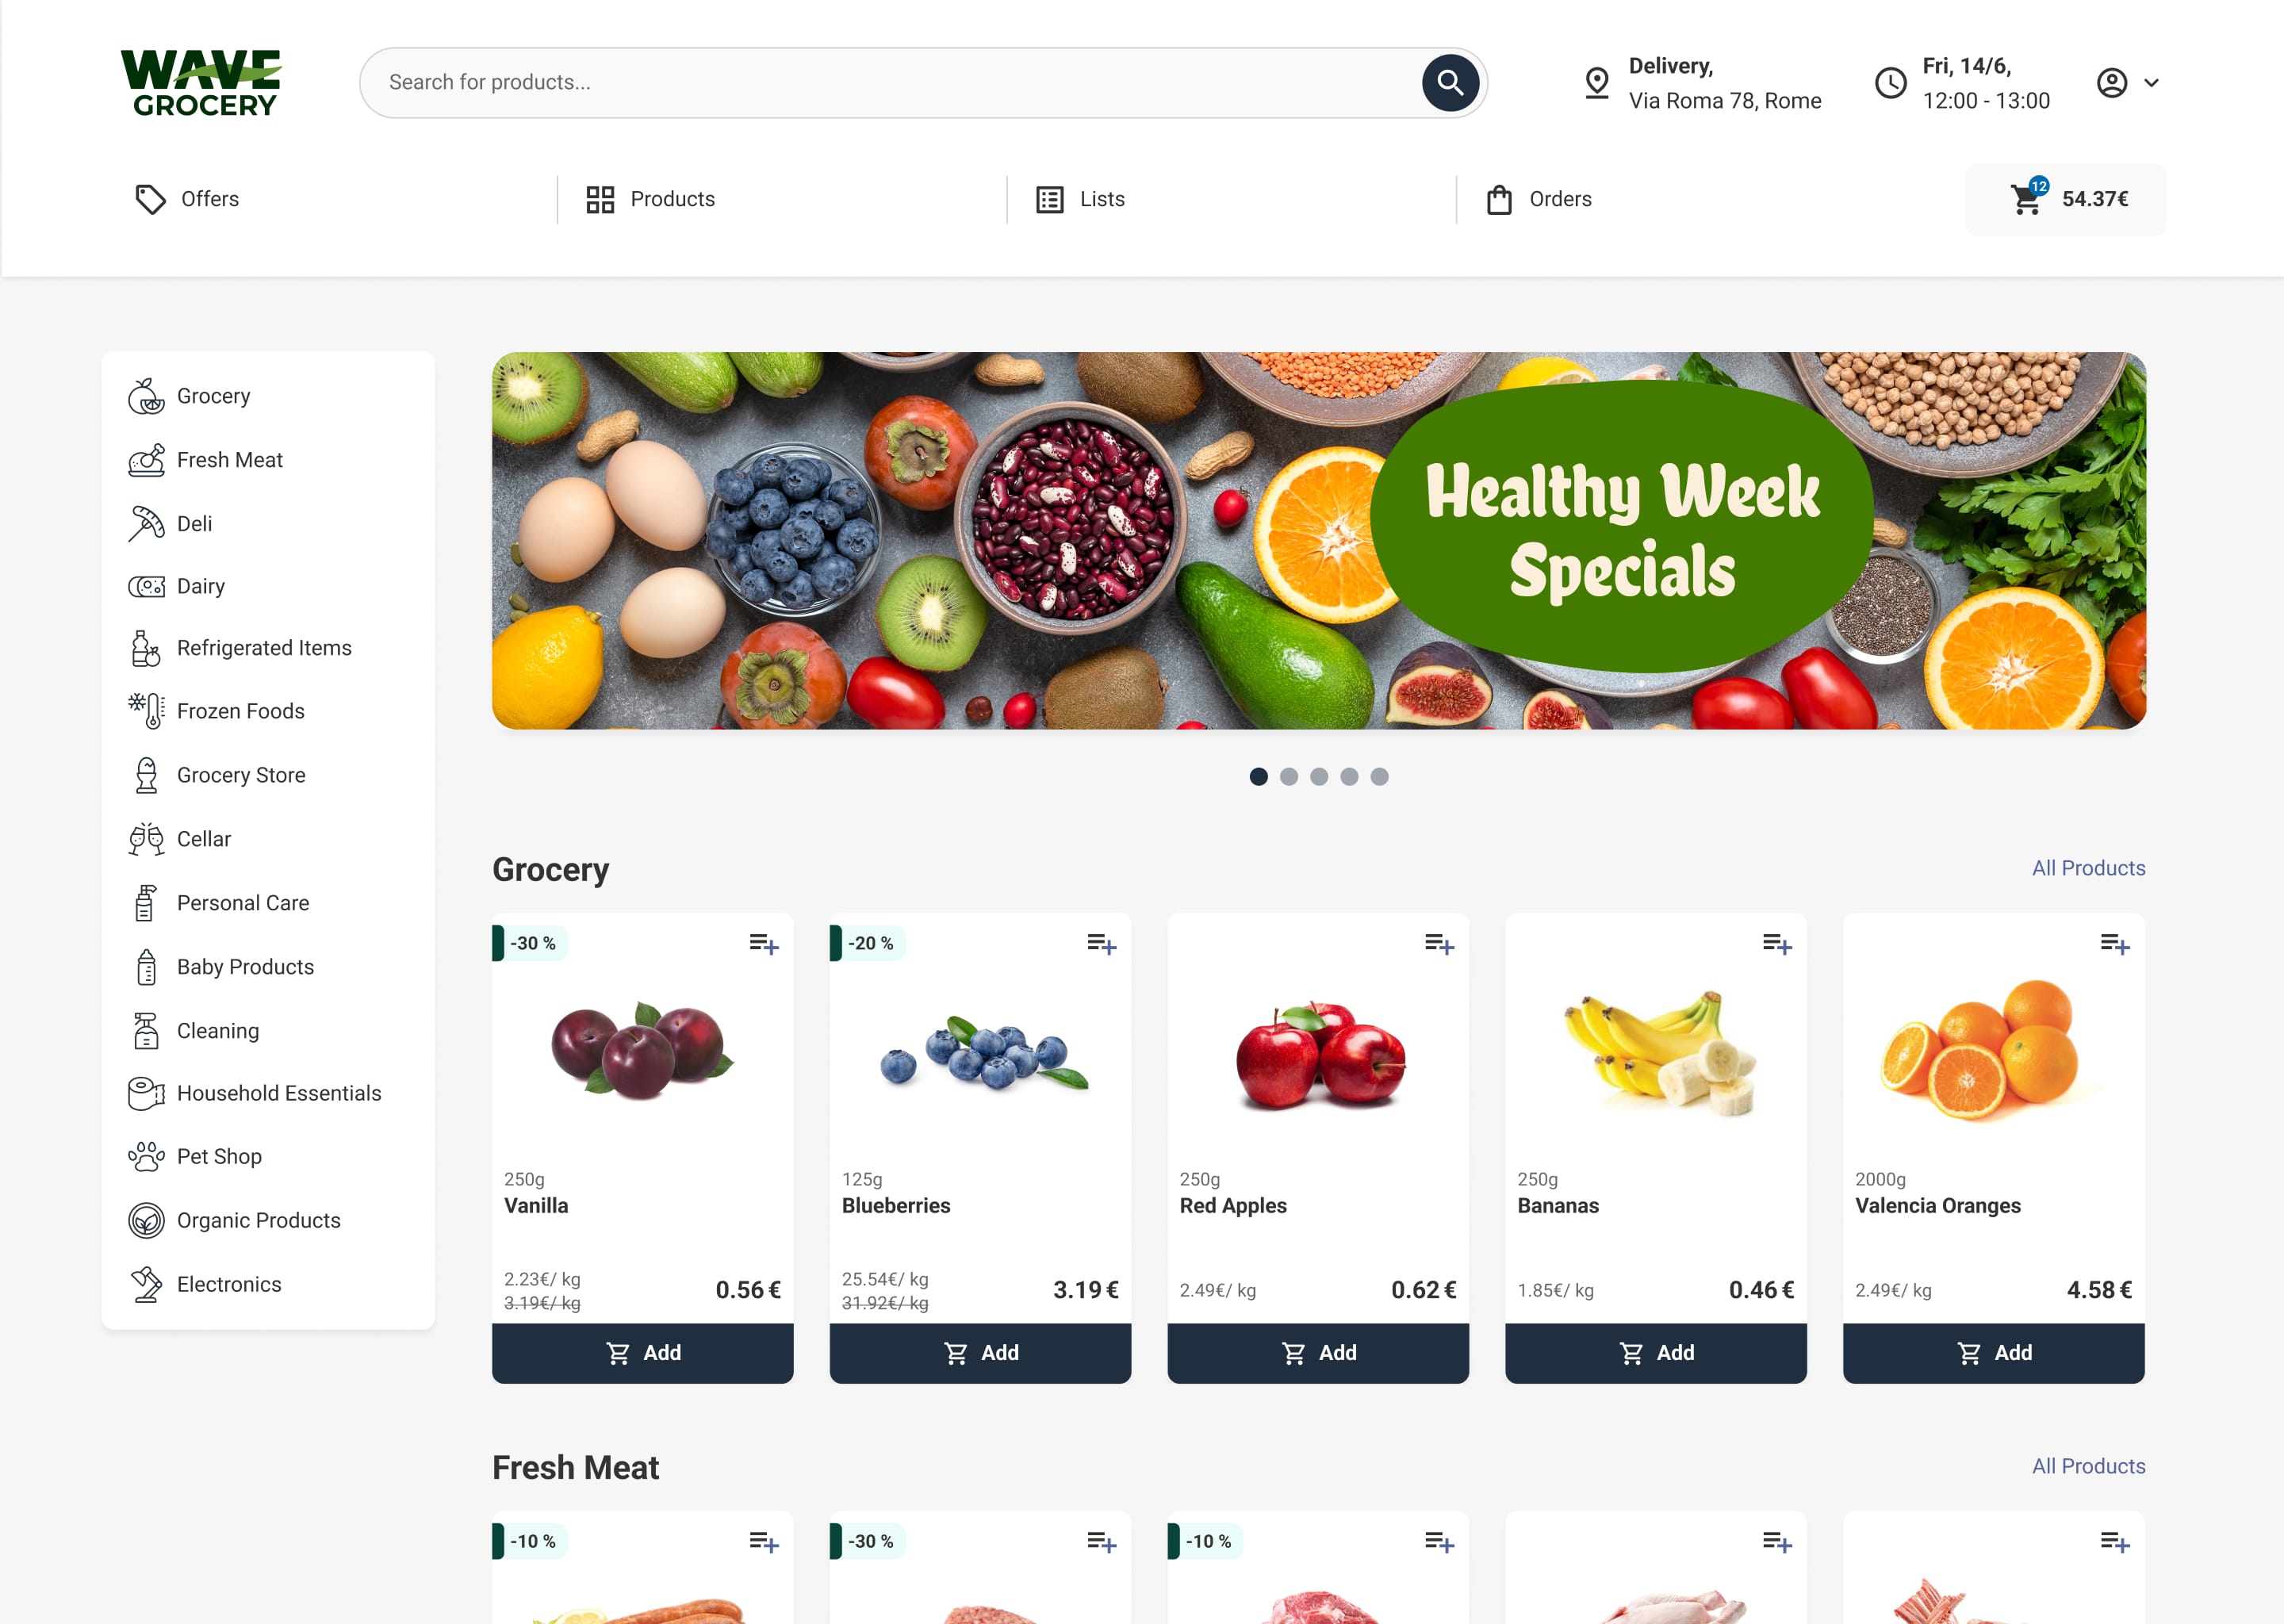
This is also where Wave Grocery can play a direct role. Its supermarket loyalty program and online grocery management system are built to help grocery retailers connect customer retention efforts with day-to-day ecommerce operations.
And the broader business case is already visible across the platform. Wave Grocery has helped Kritikos expand online ordering by 350% and handle 7x more online orders. Thanopoulos also achieved 10% sales growth after platform migration.
These are not loyalty metrics on their own. But they are strong proof that grocery-first digital infrastructure creates the conditions for better retention, better repeat behavior, and stronger customer relationships.
The same principle applies lower down in the operation too. Order picking KPIs, order picking accuracy, customer notifications, and delivery orchestration all shape the customer experience that sits behind repeat purchases and long-term loyalty.
Segment before you act
Not all customers deserve the same retention strategy. Use your loyalty metrics to segment customers into meaningful groups:
- High-value loyalists: High CLV, high frequency, high NPS. Protect and reward them.
- At-risk regulars: Previously high frequency, now declining. Investigate and re-engage before they churn.
- New customers with potential: Completed their first 2-3 orders. The onboarding window is critical.
- Low-engagement drifters: Infrequent shoppers with low basket sizes. May not be worth heavy investment.
What to measure first
If you want a practical starting point, begin with these four metrics:
- Retention rate
- Repeat purchase rate
- Purchase frequency
- Customer lifetime value
Once those are stable, layer in NPS, churn, upsell ratio, and CLI to understand the reasons behind the numbers.
Key Takeaways
- Do not rely on one loyalty metric. In grocery, loyalty is a mix of behavior, value, and sentiment.
- Focus on trends before benchmarks. Cohort movement, channel differences, and store-level patterns usually tell you more than generic industry averages.
- Combine behavioral and emotional signals. Retention, repeat purchases, NPS, and CLI work best together.
- Tie loyalty to operations. In e-grocery, customer loyalty is shaped before, during, and after checkout.
- Use connected systems. Better measurement depends on better visibility across commerce, loyalty, and operations.
Conclusion
Customer loyalty in grocery is not abstract. It shows up in repeat orders, larger baskets, stronger recommendation intent, and lower churn.
If you want to measure customer loyalty properly, start simple. Track the few metrics that actually change decisions. Review them consistently. Break them down by store, channel, and cohort. Then connect those insights to the customer experience you are delivering every day.
The retailers that do this well are not just better at reporting. They are better at keeping customers coming back.
If you want to see how a grocery-first platform can support this, explore Wave Grocery’s loyalty and management tools or book a call with the team.
Our editorial team works hand-in-hand with grocery experts and digital specialists to deliver actionable content designed to help your business thrive online. Each article is built on real industry insights and practical guidance for grocers, providing actual solutions to real problems.